Submitted by nsscadmin on
Do you know how your investments are performing annually? Thanks to rules introduced by the Client Relationship Model Phase 2 (CRM2) investors must receive an annual performance report outlining what has happened in their account over the previous 12 months.
There is no standard design for this report, so you may notice slight differences when comparing statements issued by different financial institutions. However, there are requirements on what information must be included in a performance report statement. This post will outline this information and our statement example (below), will show you how they may appear on your annual statement. You can also download a copy of the example by clicking on it.
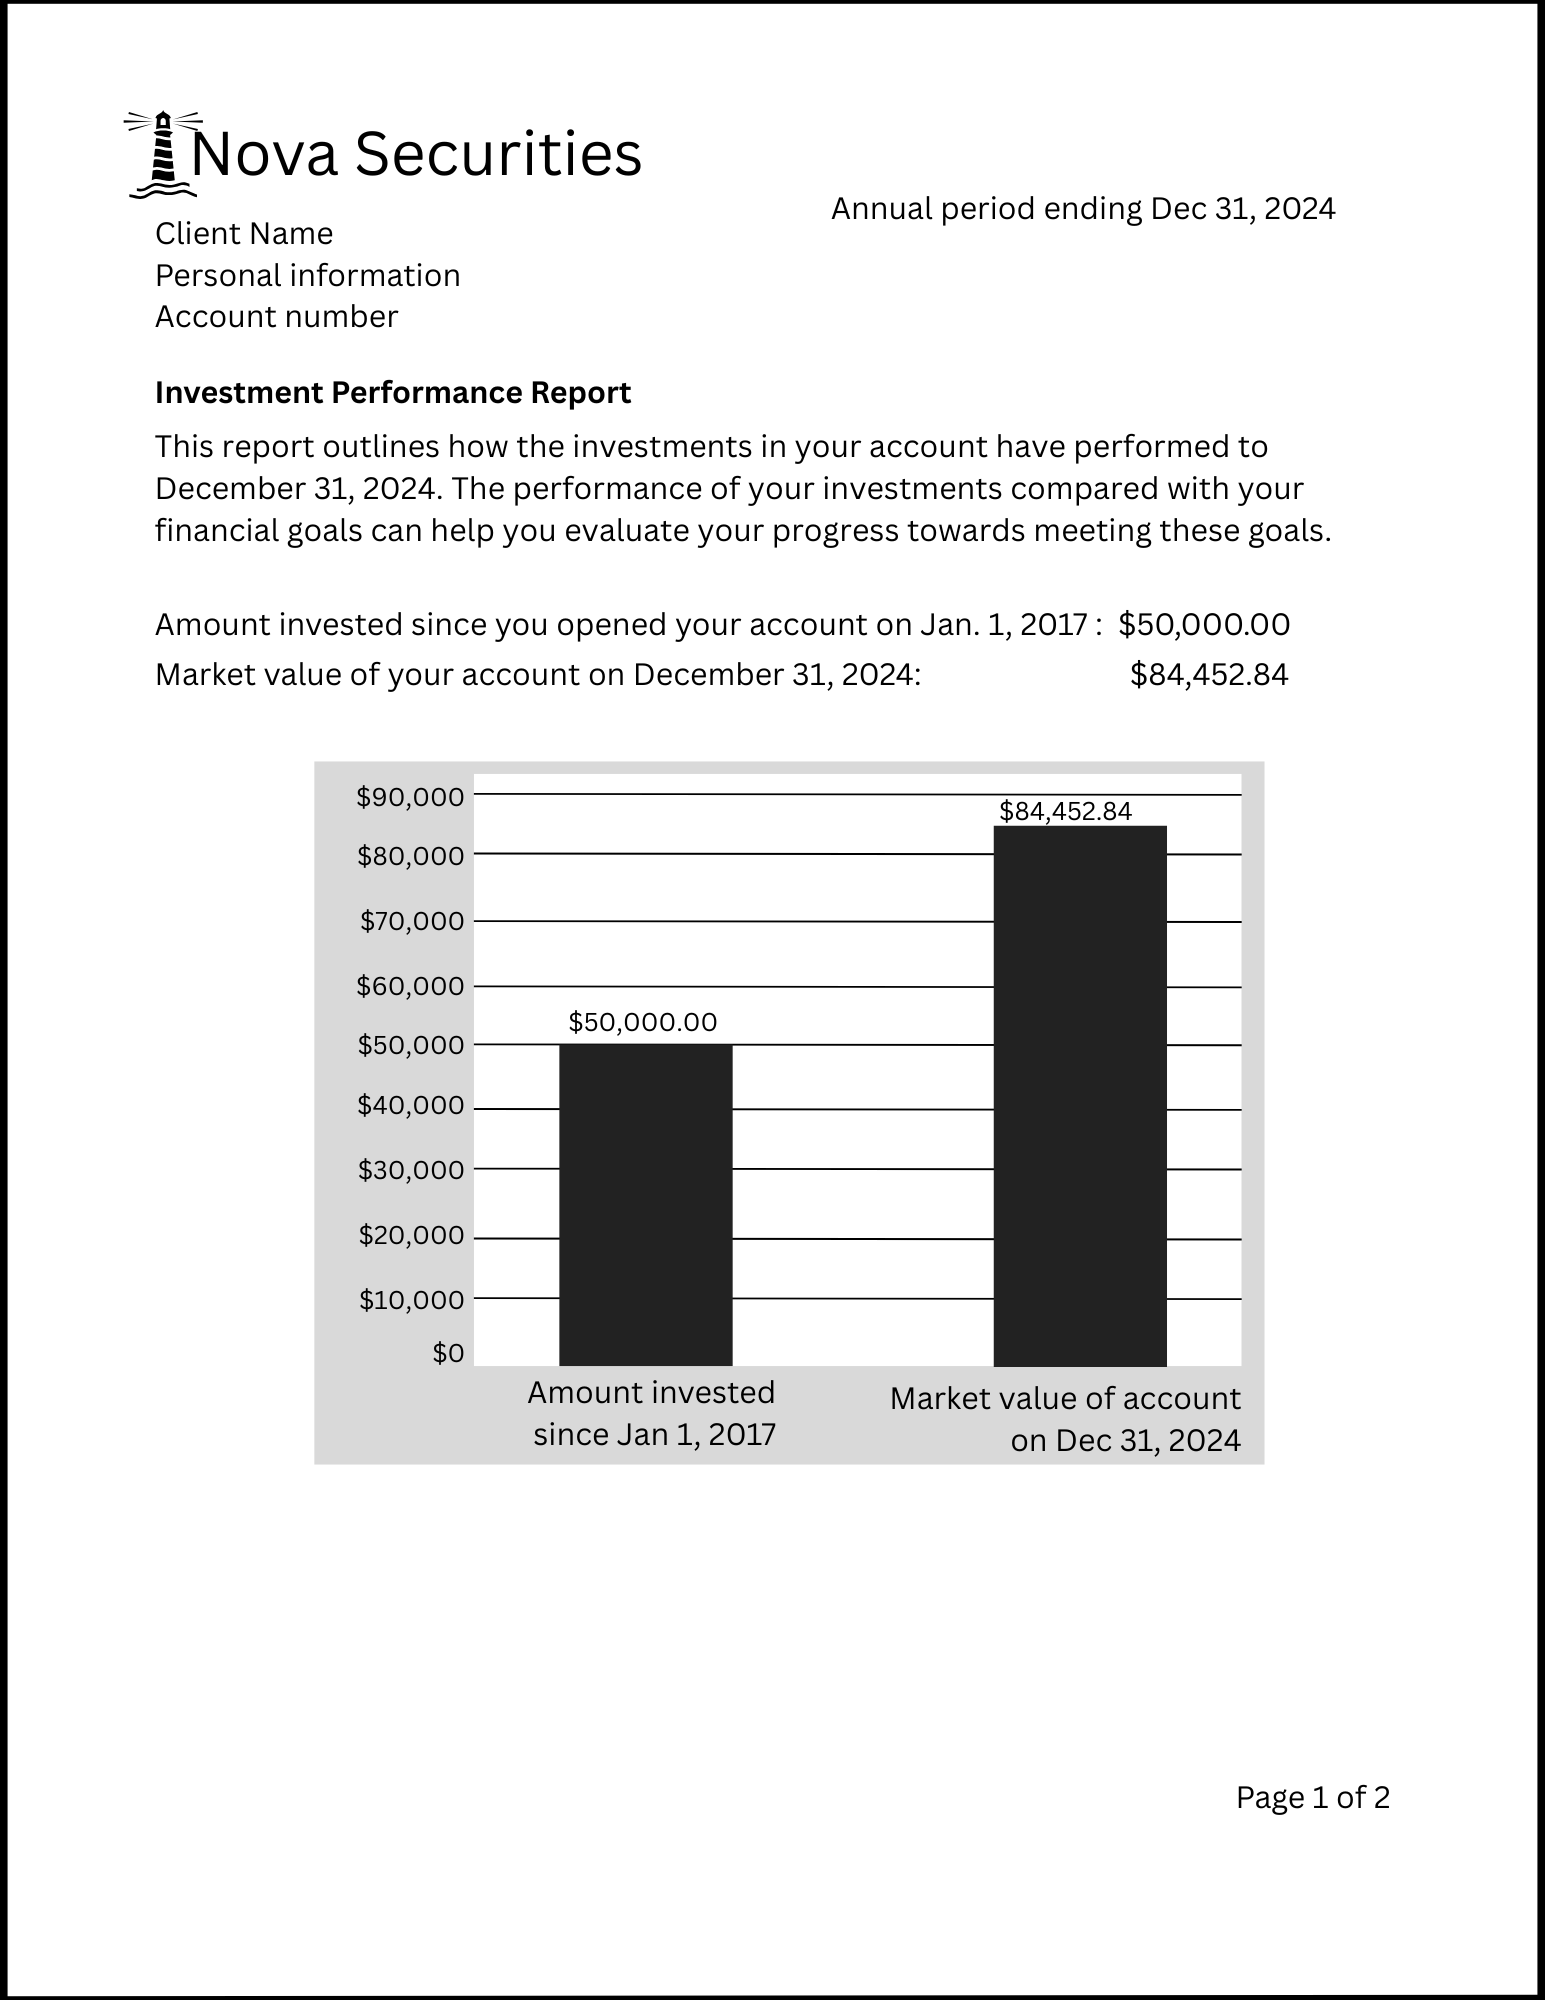

The performance report must outline the amount you’ve invested in the account since it was opened and its current market value at the end of the year. This should be written out and appear visually in the form of a chart or graph.
An accompanying table must also outline all changes in your account over the previous year and since you opened the account. As you can see in the table in our example statement this must include:
- Opening market value
- Deposits
- Withdrawals
- Change in market value
- Closing market value
Either preceding or following this table the report must include a statement outlining what appears in the table and how the final numbers are determined and calculated.
The statement must also include a table that outlines the total percentage annualized returns in your account for multiple time periods. In our statement example this includes returns from the past 12-month period, 3 years, 5 years, 10 years, and since the account was opened. Since the account in our example was only opened 7 years ago, you will see N/A in the 10-year column.
Accompanying the performance information must be a statement describing how these percentage returns are calculated. Performance must be reported using a money-weighted rate of return which takes into account all deposits and withdrawals, dividends, distributions, and the current market price of securities held. There is no approved formula, however, firms must use a method that is generally acceptable in the securities industry.
The investment performance report was designed to provide a clearer picture of how your investments are performing and how it relates to your long-term investing goals. When your performance report arrives each year make sure you review it carefully so you know how your investments are performing and whether you are still on track to achieving your investing goals.
In two weeks, we’ll take a look at the other report that is part of CRM2, the annual fees and charges report.